Worth A Thousand Words
There is over 800 billion dollars of U.S. currency in circulation worldwide. In our mobile society, watching where this currency travels can paint an interesting picture of how human travel interconnects our society in new ways. In this week’s featured image, researchers from Northwestern University used currency to track human mobility and show how following the money can redefine how we think about borders within the United States.
In a recently published study, The Structure of Borders in a Small World the authors, Christian Thiemann, Fabian Theis, Daniel Grady, Rafael Brune and Dirk Brockmann, have redrawn the borders within the U.S. by tracking the distribution of money using data from Where’s George? – a website that tracks dollar bills spent throughout the country. The movement of these bank notes from person to person represents a link between two geographic places.

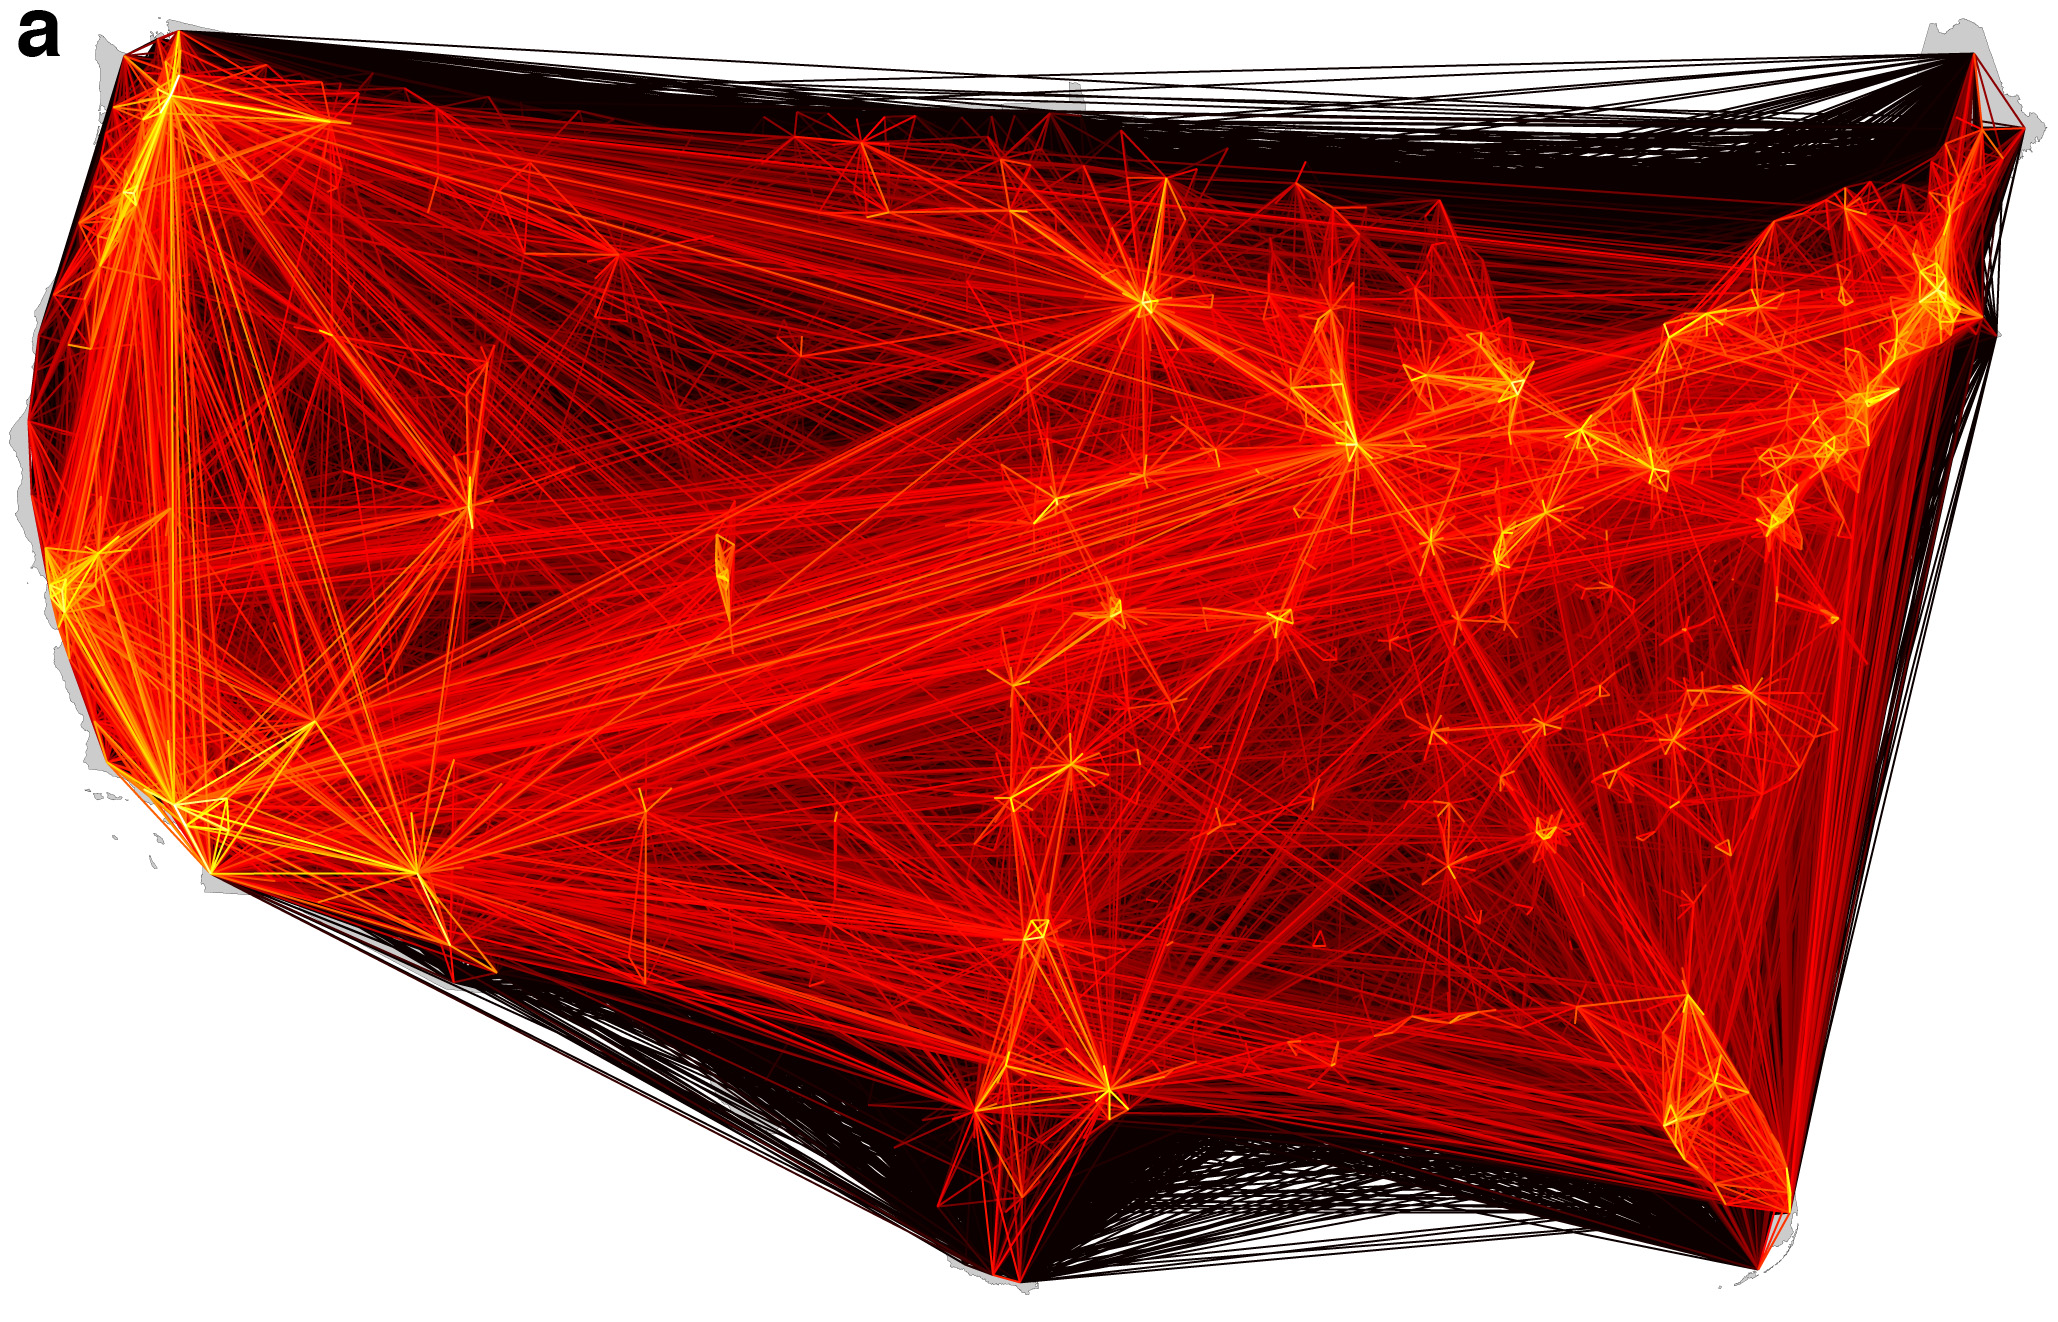
The above figure represents the movement of bank notes between 3,109 counties in the lower 48 United States and is Figure 1a of the manuscript. As Dr. Dirk Brockmann, the author who led the study explains:
Each line connecting two counties symbolizes the flux of money between them. The bright yellow lines indicate strong flux whereas dark red indicates small flux. The network reflects the connectivity of strength between two locations. This emergent multi-scale mobility network is characterized by strong local bonds but also significant long range connections.
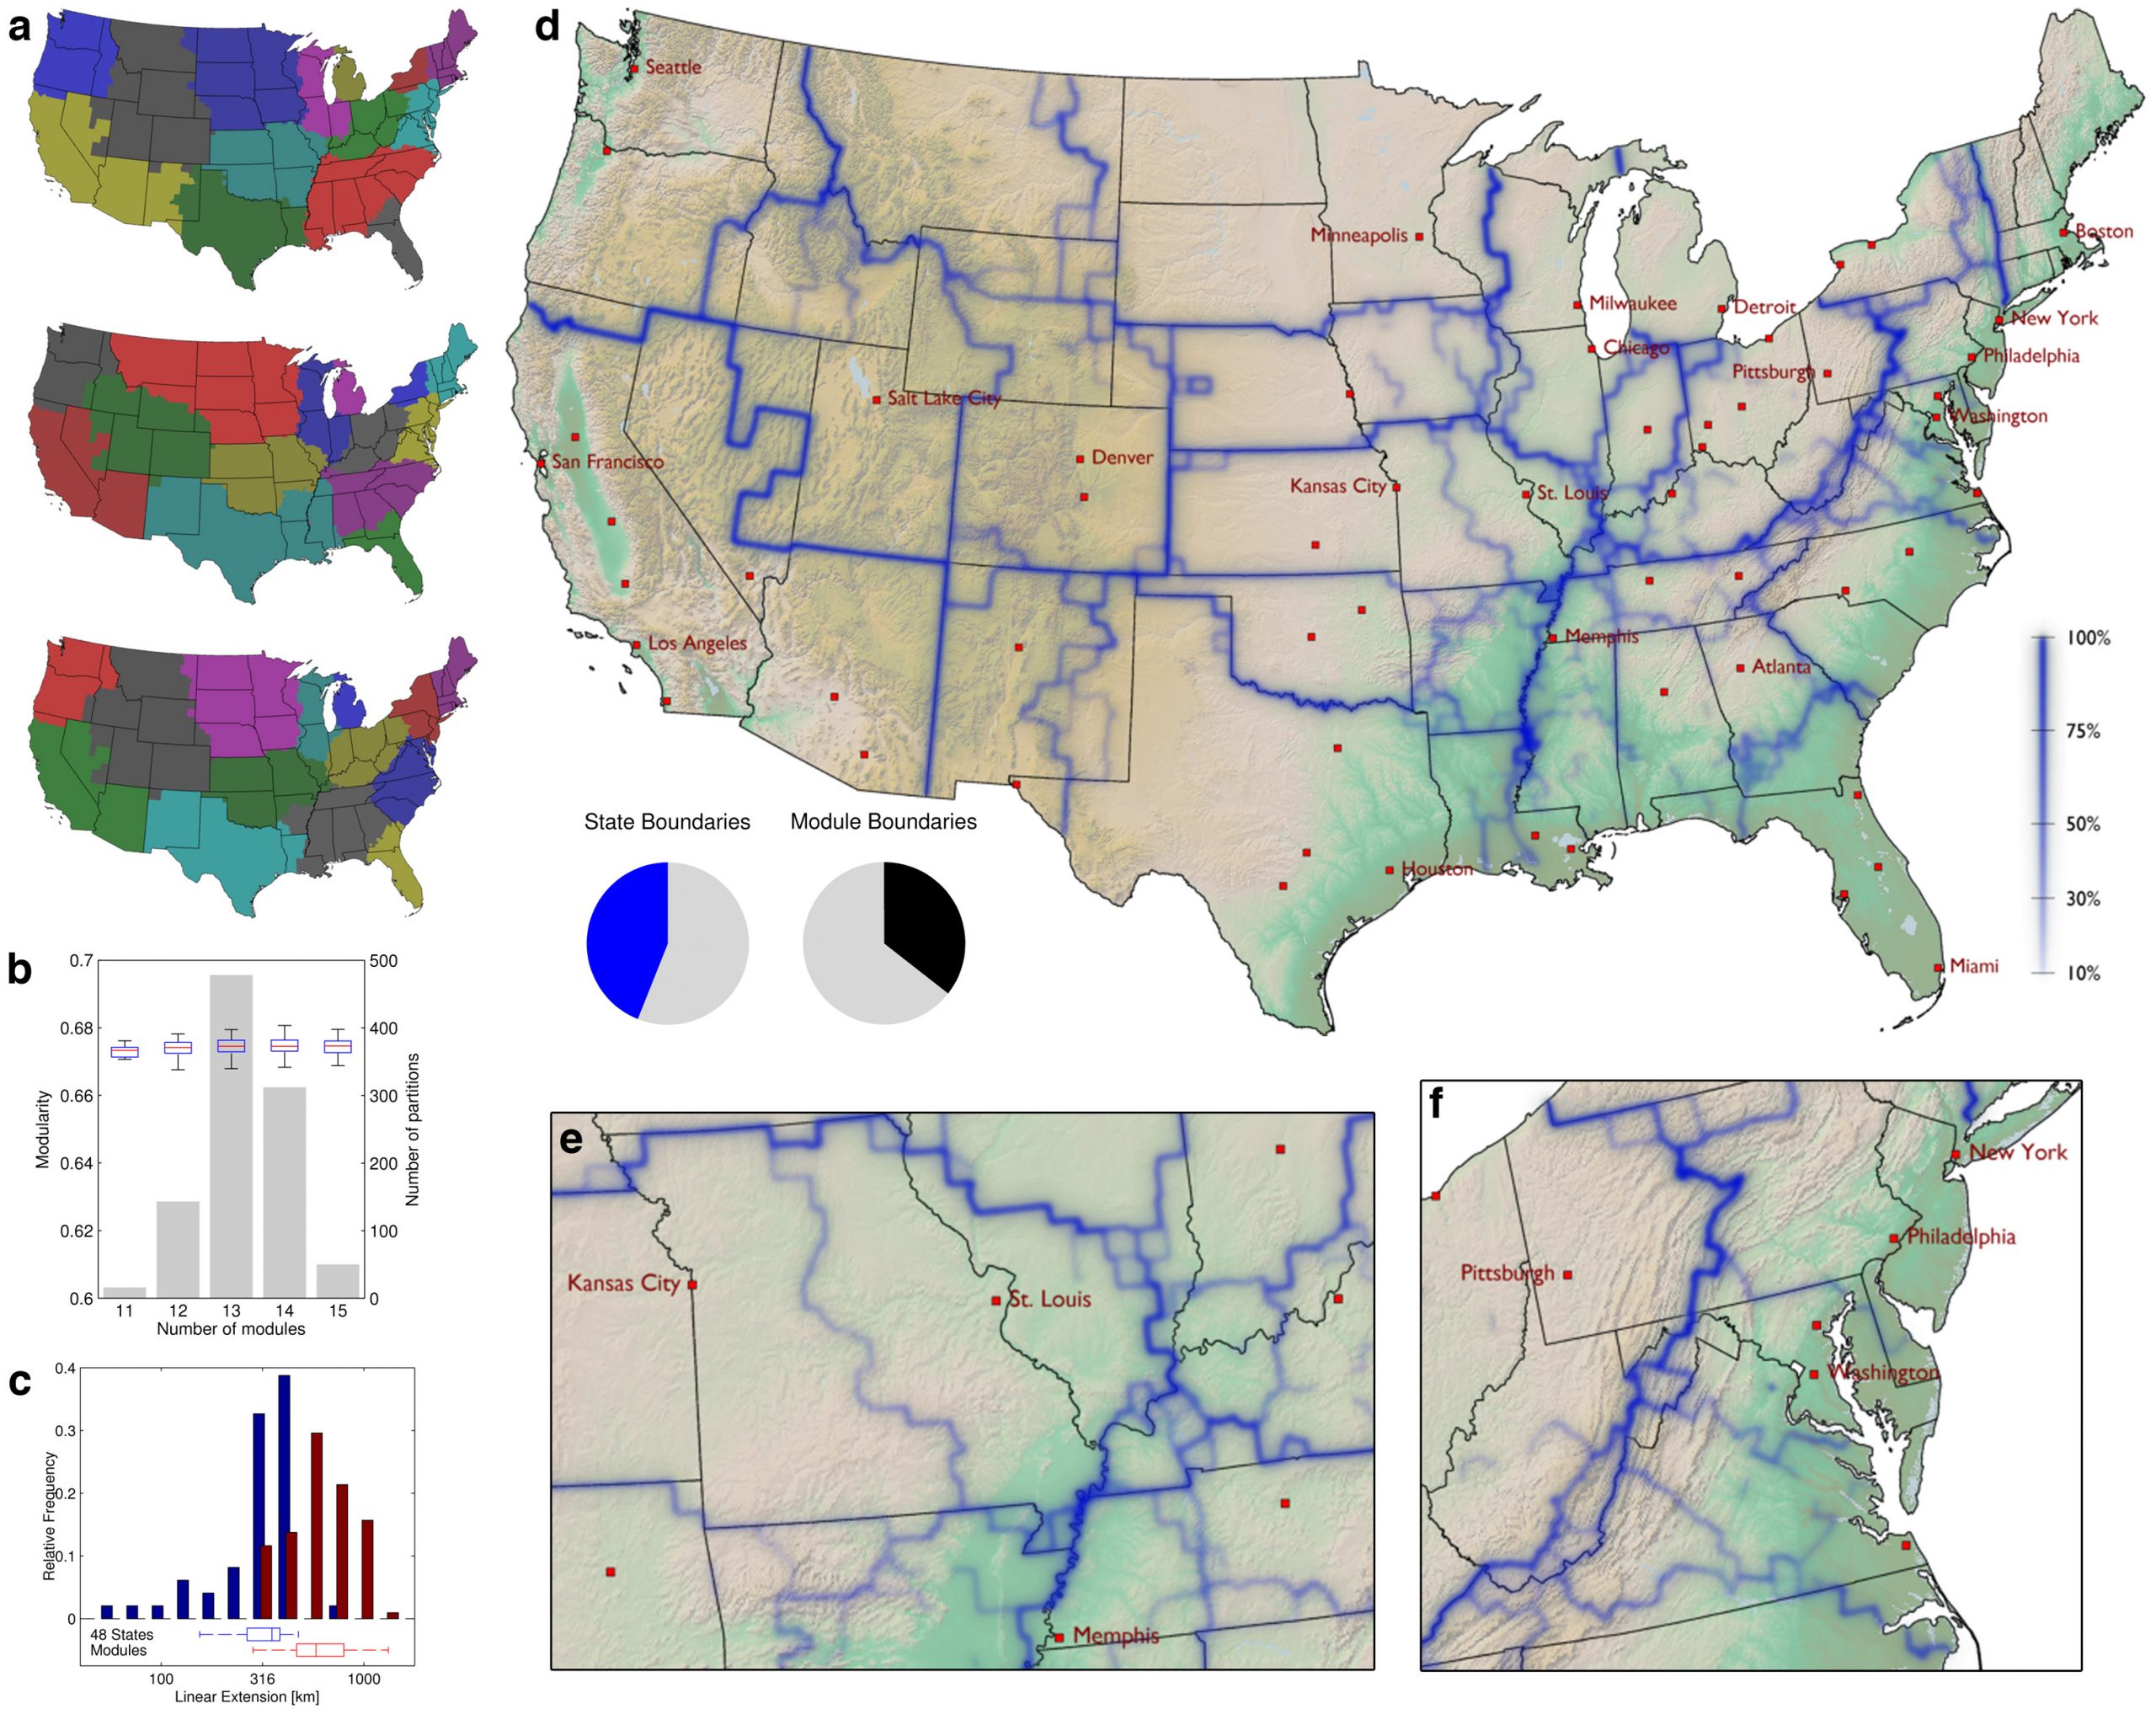
The image below comes from Figure 2 of the paper and shows the mobility borders in the United States.
The map shows borders (blue) that appear in at least 10% of the 1,000 different divisions we have computed. The darker a border the more divisions it appears in, i.e. the more significant it is. Black lines indicate state borders. Sometimes these effective borders coincide with political borders border, topographical features. But they can also split States for instance Wisconsin, Pennsylvania, Missouri and Illinois.
Authors Christian Thiemann and Daniel Grady, also created a five minute video called Follow the Money which helps illustrate the team’s research.
As with all PLoS content, the images and text from this article can be downloaded, modified, distributed or otherwise reused, as long as the authors and journal are credited. This article is also freely available for you to comment on and rate.

